
Golang remote profiling and flamegraphs


Quite often we are found with a challenge to troubleshoot something in production, or to see why is our application slow, or why isn’t it serving requests fast enough.
We can use golang tool pprof to troubleshoot our system.
Golang has a package called pprof that provides an HTTP server with runtime profiling data in the format expected by the visualisation tool. We need to make sure that this endpoint is never exposed as it can leak sensitive data.
Profiling most commonly allows us to optimize our application, by providing dynamic analysis of various aspects of the running application.
In Golang there are several profilers that we can use as of version 1.11, and they are
- allocs: A sampling of all past memory allocations
- block: Stack traces that led to blocking on synchronization primitives
- cmdline: The command line invocation of the current program
- goroutine: Stack traces of all current goroutines
- heap: A sampling of memory allocations of live objects. You can specify the gc GET parameter to run GC before taking the heap sample.
- mutex: Stack traces of holders of contended mutexes
- profile: CPU profile. You can specify the duration in the seconds GET parameter. After you get the profile file, use the go tool pprof command to investigate the profile.
- threadcreate: Stack traces that led to the creation of new OS threads
- trace: A trace of execution of the current program. You can specify the duration in the seconds GET parameter. After you get the trace file, use the go tool trace command to investigate the trace.
Profile and optimize only if you know that you have a performance problem. Because premature optimization is not only a waste of your time, but it will also slow you down in the future if you have to refactor your brittle and finely-tuned code. Attaching the network profiler has negligible performance overhead, so we can run it in production with live traffic without any noticeable performance penalties, and it gives you insight into how your application works with live data.
Profiling
Let’s look at some profiles to get us started. Before we begin let’s clone the GitHub repository locally so we can check it out and run it.
$ mkdir $GOPATH/src/github.com/ilijamt -p
$ cd $GOPATH/src/github.com/ilijamt
$ git clone https://github.com/ilijamt/gomeetupamsoct2018
$ cd gomeetupamsoct2018
CPU Profile
The CPU profiler runs for 30s, and uses sampling to determine which functions spend the most of the CPU time. The go runtime stops the execution every 10ms and records the stack of all running goroutines. If you want to increase the sampling rate you can take a look at SetCPUProfileRate.
$ cd pprof
$ go build
Just running the application won’t really help us, as we need to generate some load on the application so the profiler can gather the CPU samples while it’s running under load.
First we need to run the compiled application, and then generate some load, while the ab commands are running we need to run go tool pprof pprof http://127.0.0.1:6060/debug/pprof/profile
$ ./pprof &
$ ab -k -c 8 -n 100000 "http://127.0.0.1:6060/concat/?str=test&count=50" &
$ ab -k -c 8 -n 100000 "http://127.0.0.1:6060/fib/?n=50&type=recursive" &
$ ab -k -c 8 -n 100000 "http://127.0.0.1:6060/fib/?n=50&type=iterative" &
So in a different terminal we need to run at the same time
$ go tool pprof pprof http://127.0.0.1:6060/debug/pprof/profile
After it finishes dumping you can examine it when you need using the command
$ go tool pprof -http=:8080 dumps/pprof.pprof.samples.cpu.001.pb.gz
Let’s examine the CPU profile and see what is going on, if you want to play around with it you can run the command above and check the interactive graph and play with it.
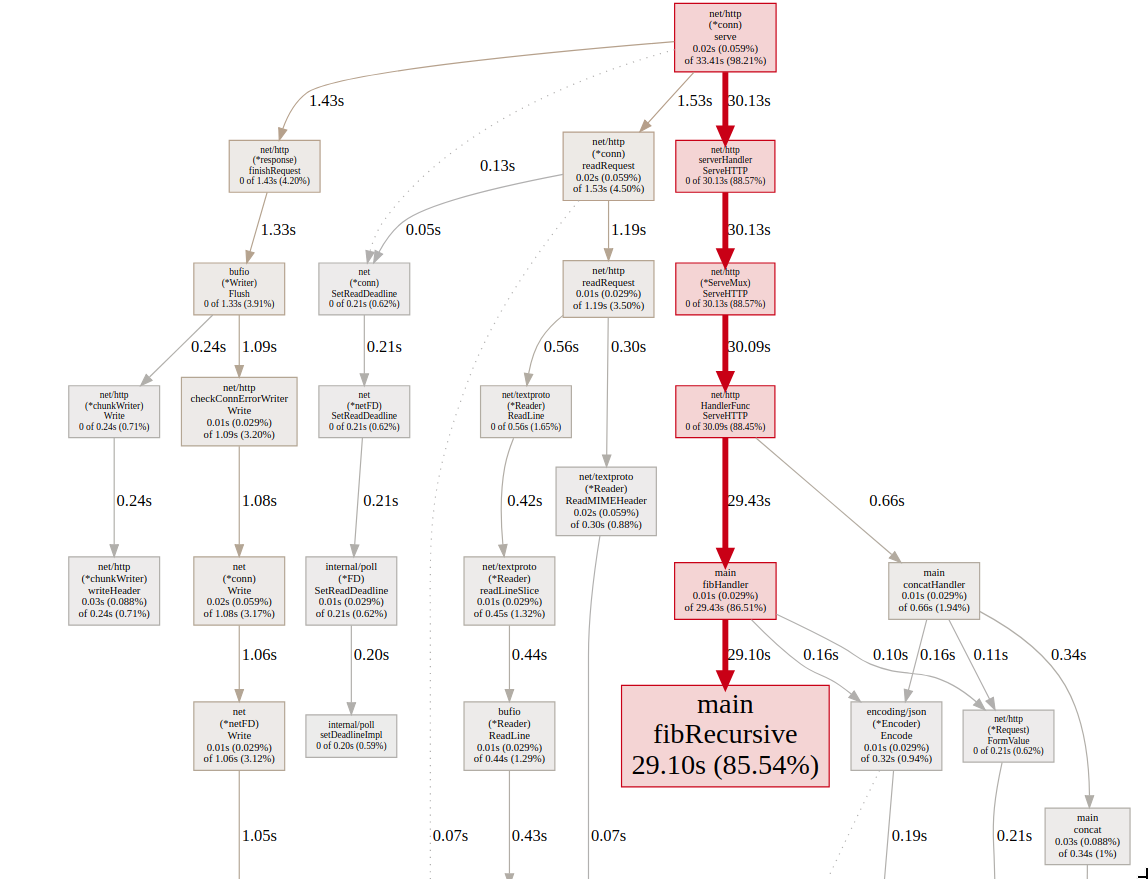
On the graph we can see that most of the CPU time was spent in fibRecursive function which calculates the fibonacci number recursively. Let’s take a look at the function implementation, to see what it’s doing.
func fibRecursive(n int64) int64 {
	if n < 2 {
		return n
	}
	return fibRecursive(n-1) + fibRecursive(n-2)
}
Now let’s take a look at the flame graph
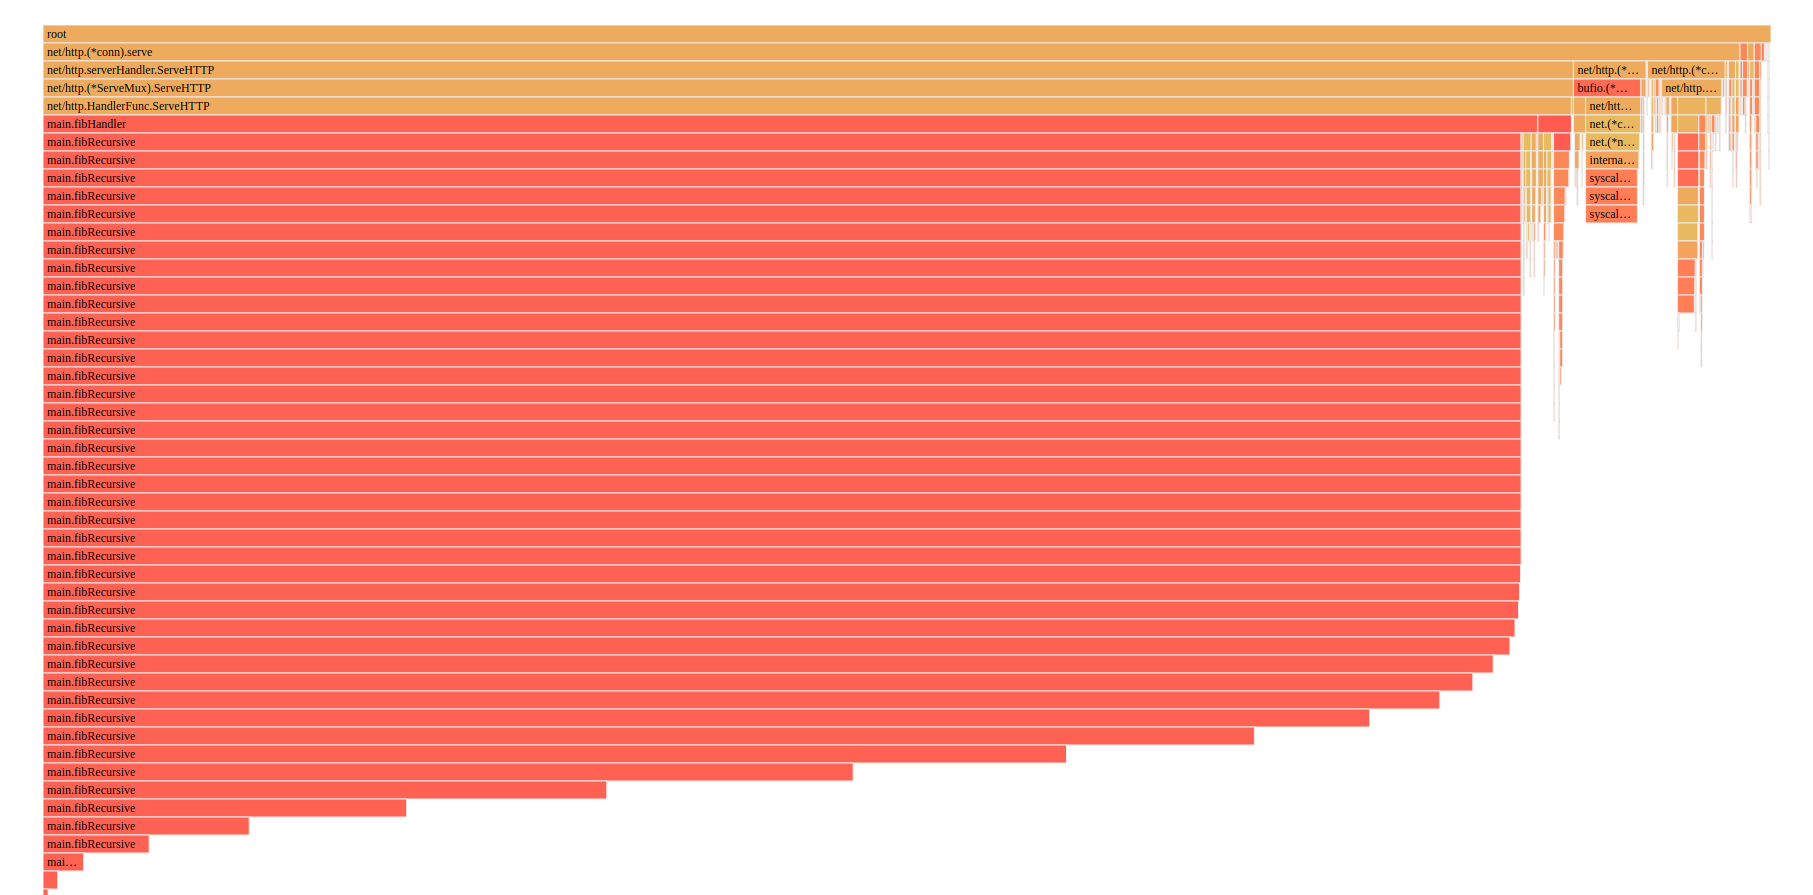
We can also see from the flame graph that most of the time it’s the fibRecursive function that is slowing the application down.
We can drill even more down to see which part of fibIterative and fibRecursive is taking the most time.
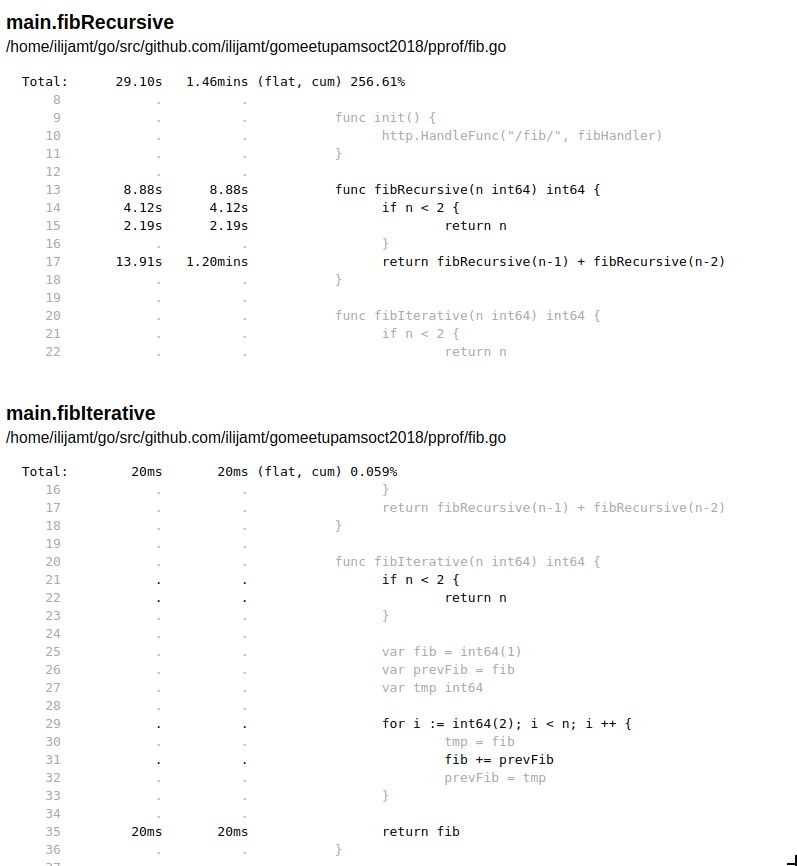
As a comparison I’ve put both fibIterative and fibRecursive so we can see the difference in implementation.
We can see that fibRecursive takes on average 13.91 sec to run, and total 1.2 minutes, versus the fibIterative which is 20ms.
We can play with the pprof ui tool and investigate more in details about what is going on, but I leave that up to you the reader to do so.
Heap profile
$ ./pprof &
ab -k -c 80 -n 1000000 "http://127.0.0.1:6060/concat/?str=test&count=5000"
So in a different terminal we need to run at the same time, this is usually quite quick to create a heap profile unlike the CPU profile
$ go tool pprof pprof http://127.0.0.1:6060/debug/pprof/heap
After it finishes dumping you can examine it when you need using the command
$ go tool pprof -http=:8080 dumps/pprof.pprof.alloc_objects.alloc_space.inuse_objects.inuse_space.001.pb.gz
After it finishes dumping we can investigate the data we have collected and check out the issues that we have in our current system
Let’s take a look at the data, there are four parameters that we can pass to check out the application details and in short the profiler too can show you either allocation counts or in memory use. If you are concerned with the amount of memory being used, you want to take a look at the in memory use metrics, but if you are want to know about the garbage collection you look at the allocations. For more details you can take a look at the memory profiler, the code has quite a lot of useful comments about how it works.
Let’s look at some of the data that we’ve collected
alloc_object, alloc_space
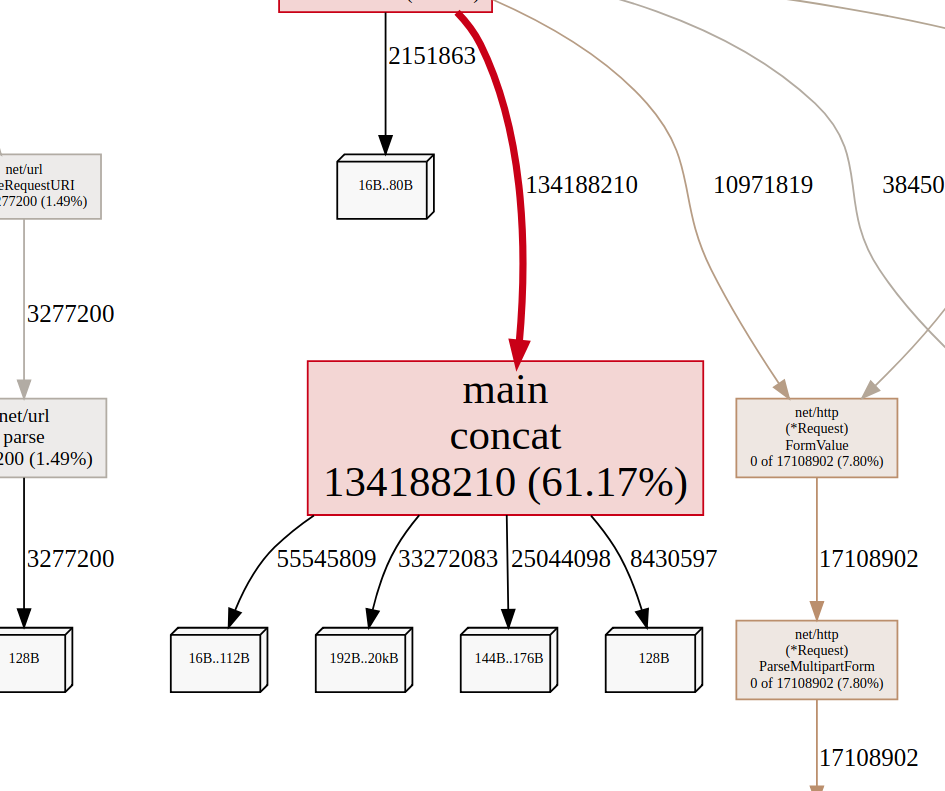
From the picture we can see that we have allocated quite a lot of object in contact, up to 61.7% of the objects allocated came from that function.
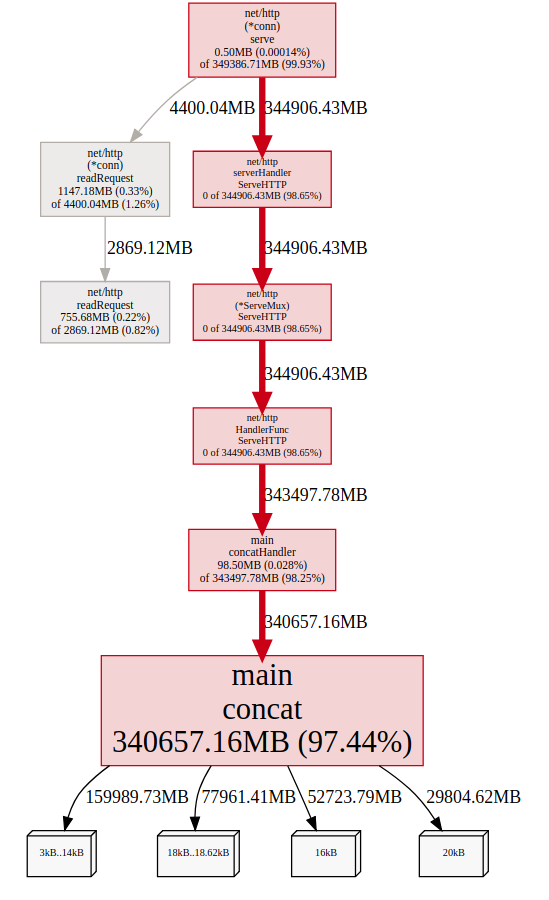
From the picture we can see that we have allocated a whole of objects up to a total of 340GB
inuse_object, inuse_space
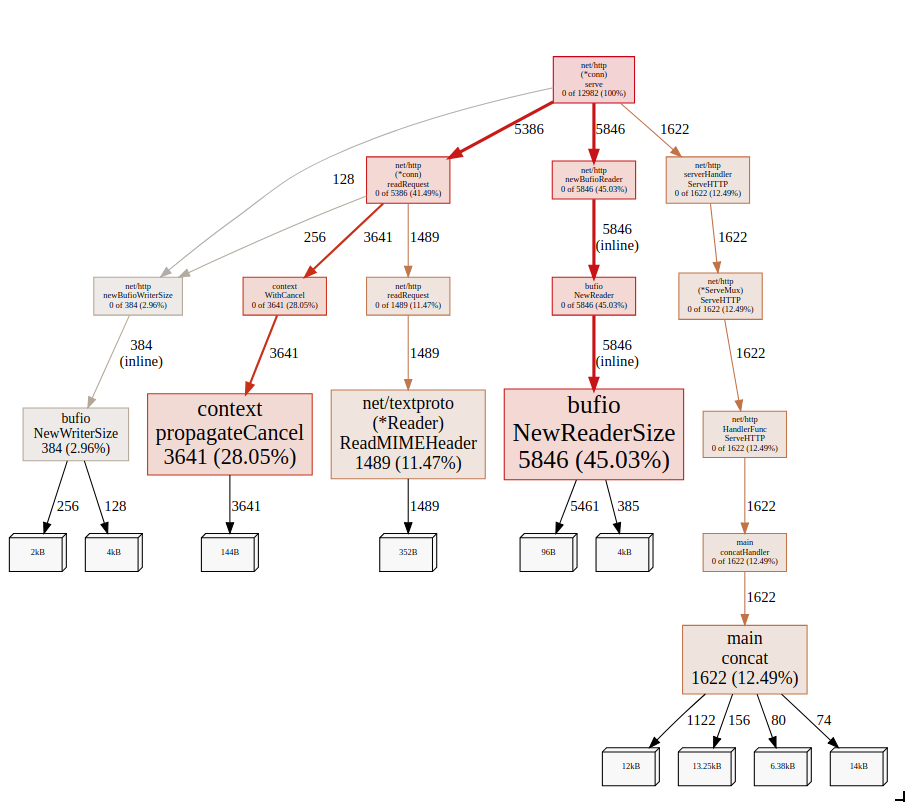
But when we look at the inuse objects of the application we can see that concat is not the one that created the most objects, but bufio.NewReaderSize
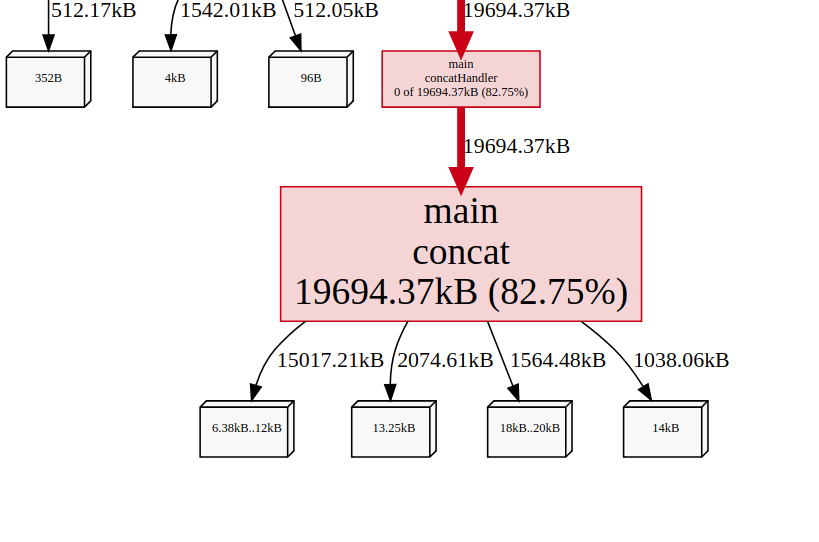
But if we take a look at the inuse space, we can see that the concat function uses whole 19.23MB of memory which accounts for a total of 82.75% of the whole memory usage.
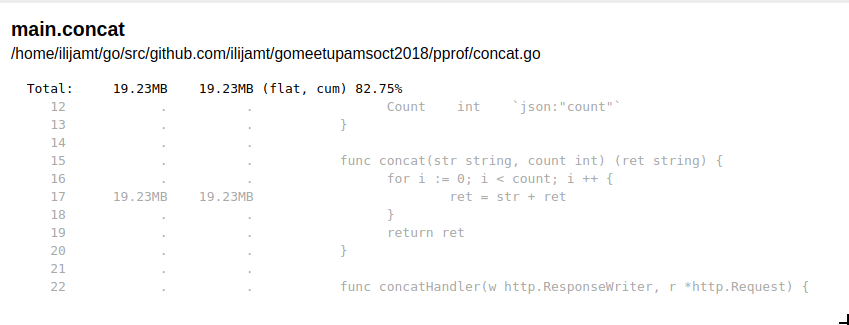
And if we drill down we can see where is the memory being allocated, and it’s on the line 17 on the picture, we can easily improve this one by creating a buffer and writing to it instead of prepending a new string each time, which creates new objects all the time. Just replacing the function concat with
func concatV2(str string, count int) (ret string) {
	data := bytes.NewBuffer([]byte{})
	for i := 0; i < count; i ++ {
        data.WriteString(str)
	}
	return data.String()
}
We can verify that we are doing less allocations now and we are actually using less memory, I leave it up to you to check out the details, there is already a dump in dumps/pprof.pprof.alloc_objects.alloc_space.inuse_objects.inuse_space.002.pb.gz in the GitHub repo that you can use right away.
Go routines
This is an interesting one, it creates a dump of the goroutine call stack and the number of running goroutines. Let’s take a look at the profile of the dump we did, but before we do let’s generate the dump.
$ ./pprof &
ab -k -c 80 -n 1000000 "http://127.0.0.1:6060/concat/?str=test&count=5000"
So in a different terminal we need to run at the same time, this is usually quite quick to create a goroutine profile unlike the CPU profile.
$ go tool pprof pprof http://127.0.0.1:6060/debug/pprof/goroutines
After it finishes dumping you can examine it when you need using the command
$ go tool pprof -http=:8080 dumps/pprof.pprof.goroutine.001.pb.gz
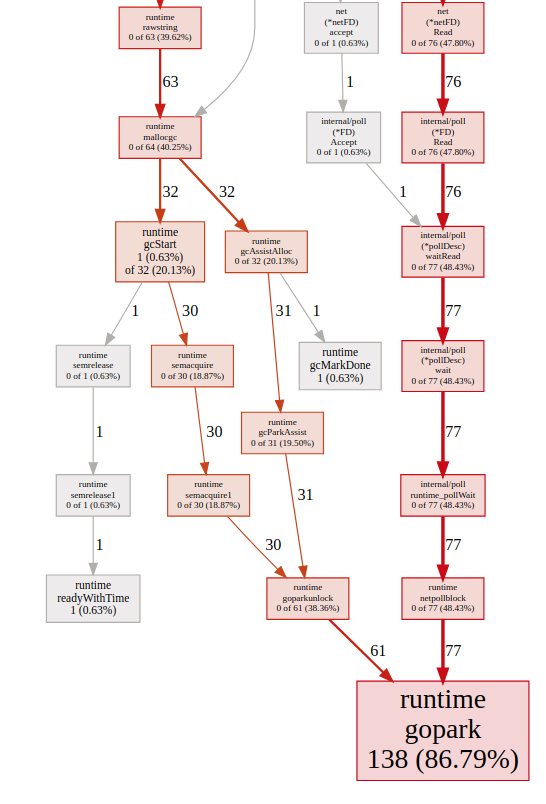
Graph
Flame-graph
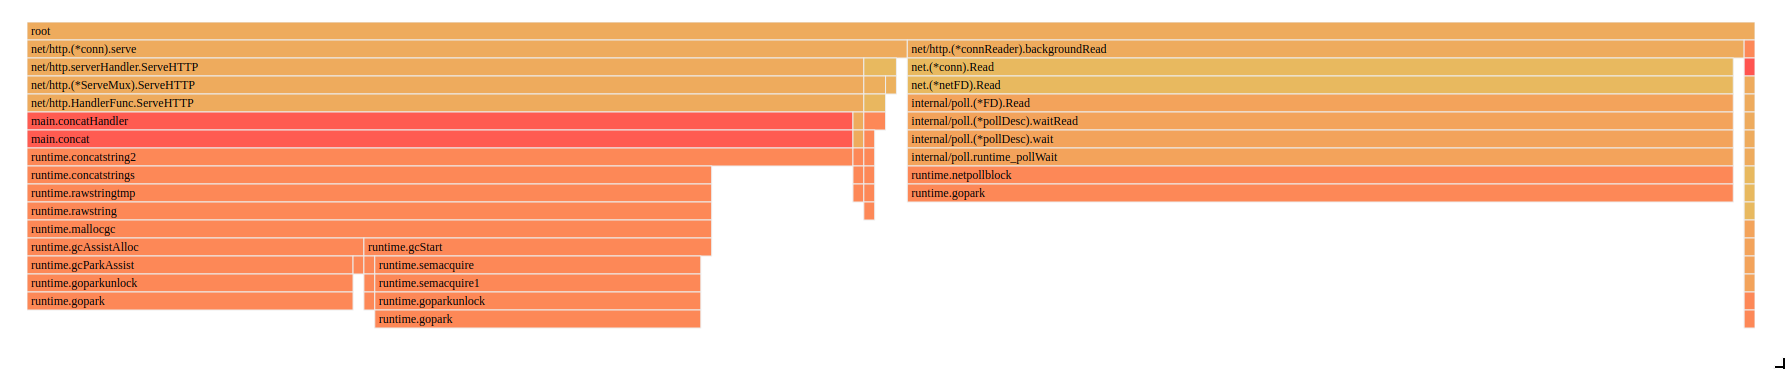
If we take a look at both the graph and flamegraph, we can see that the biggest time we spend is something called runtime.gopark, if we take a look at the code comments of what this function does, we can see
// Puts the current goroutine into a waiting state and calls unlockf.
// If unlockf returns false, the goroutine is resumed.
// unlockf must not access this G's stack, as it may be moved between
// the call to gopark and the call to unlockf.
// Reason explains why the goroutine has been parked.
// It is displayed in stack traces and heap dumps.
// Reasons should be unique and descriptive.
// Do not re-use reasons, add new ones.
This is the goroutine scheduler, which happens because we spawn a lot of goroutines to serve every request, we should maybe think about limiting the amount of requests that we serve.
Block profile
It show function calls that led to blocking on synchronization primitives like mutexes and channels. One thing to remember is that before dumping the profile we have to SetBlockProfileRate in the application either in the main or the init function. We need to do this so we can capture the profiling information.
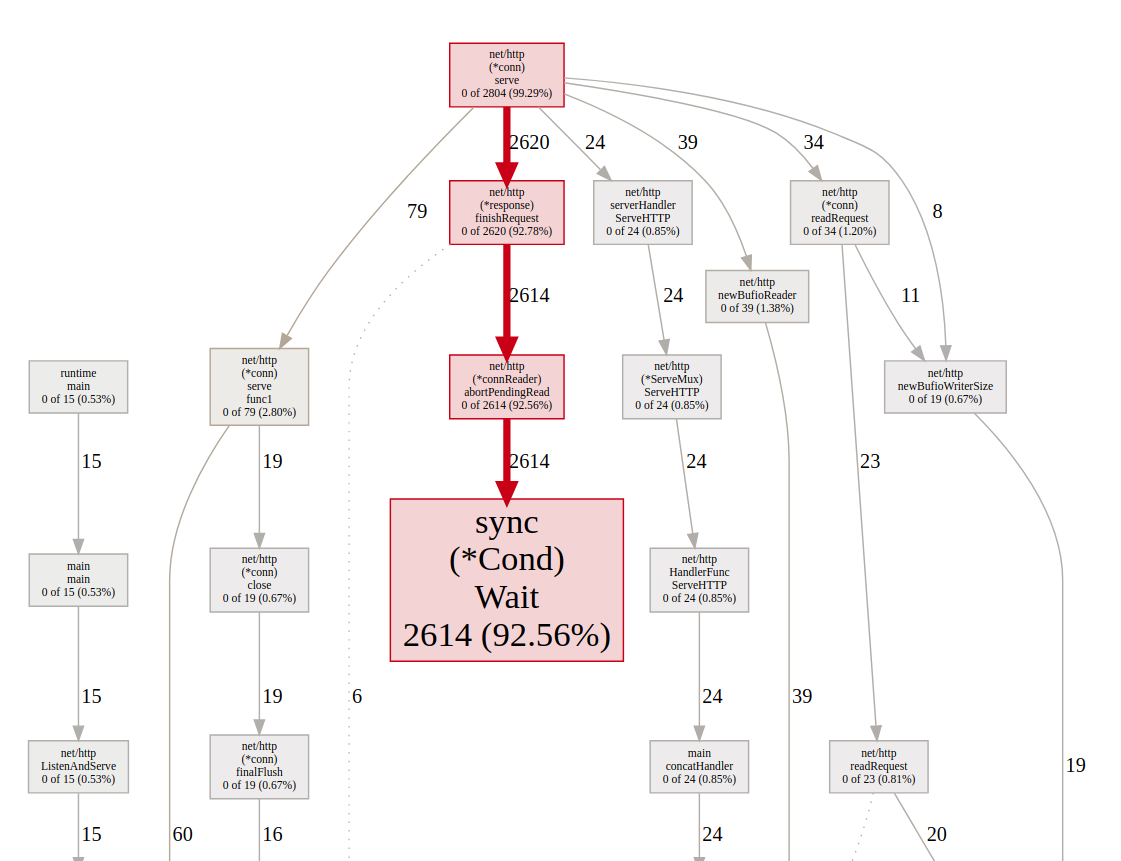
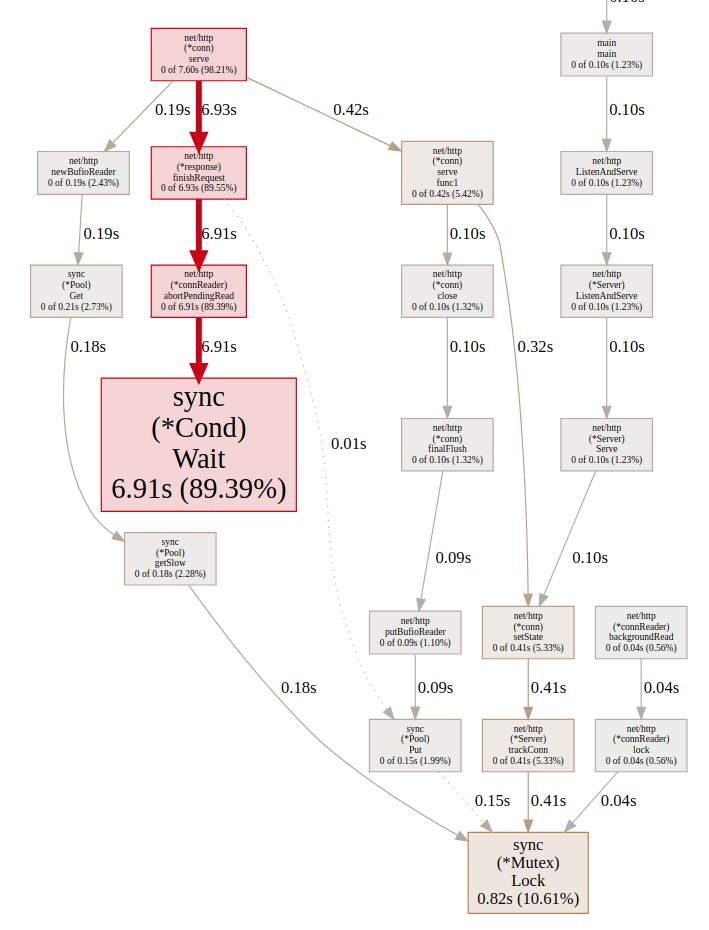
Contentions
In the picture we can see a lot of the time is spend in sync.Cond which is a conditional variable, with a an associated locker (often a *Mutex or a *RWMutex), which is held when changing the condition and when calling the Wait
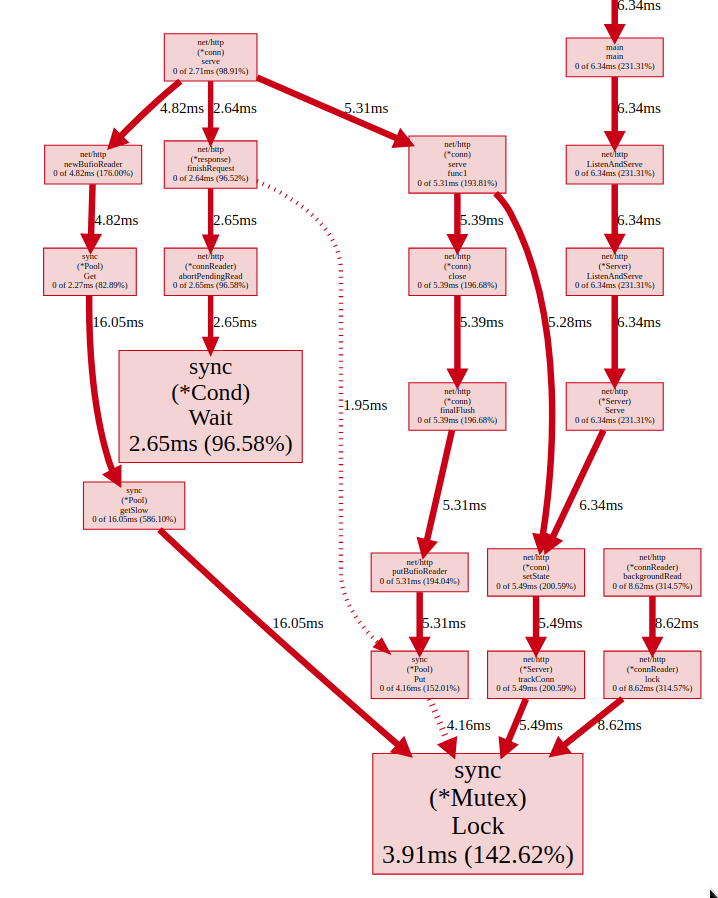
Mean delay
In this picture we can see the mean delay for each block, which for sync.(*Cond).Wait is 2.65ms and sync.(*Mutex).Lock is 3.91ms.
Total delay
In this picture we can see the total time spent in each block, and in our case the sync.(*Cond).Wait is the problem because it’s being called 2614 times which brings to total time 6.91s.
Trace
And last but not least it’s the tracing tool, which visualizes the runtime events in fine detail over a run of a your application.
But I should also note that we shouldn’t use trace if you want to track down slow functions, or find where exactly is your program is spending most of its CPU time. For problems like that you should use pprof. trace is useful if you want to find out what is your program doing over time.
Let’s dig in a bit with the tracing now, to be able to trace we have to create a tracing file.
We can download the trace file just by doing executing the command bellow, and in the 10 seconds we need to generate some load to have some meaningful traces
wget http://localhost:6060/debug/pprof/trace?seconds=10 -O dumps/trace
go tool trace dumps/trace
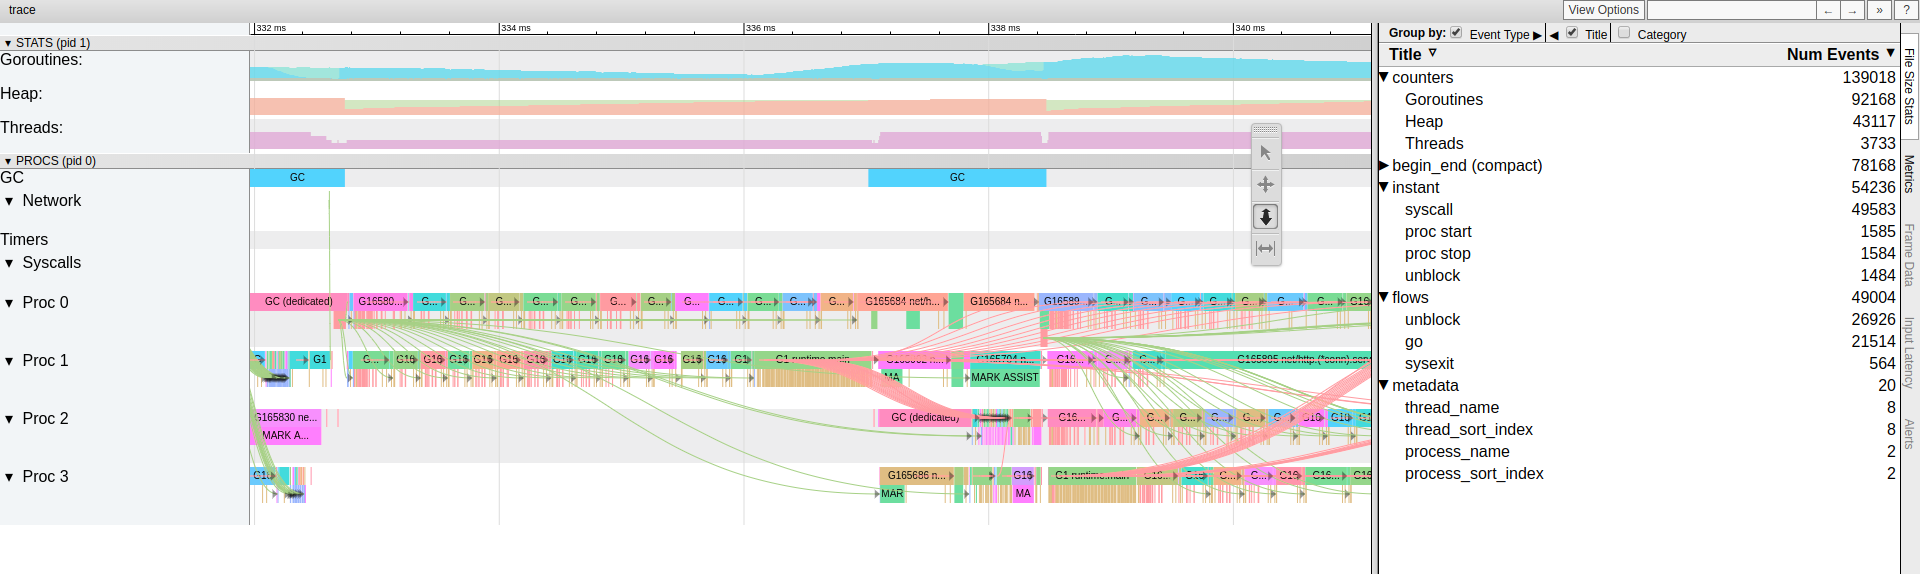
We can see here what was executed at what point and what exactly was the flow between each piece in the system.
There are various other tools that trace has that can be of use to us like.
- View trace
- Goroutine analysis
- Network blocking profile
- Synchronization blocking profile
- Syscall blocking profile
- Scheduler latency profile
- User-defined tasks
- User-defined regions
Comparison of different profiles
We can also compare several profiles and visualise the differences between them, this is applicable to any pprof profile (except maybe trace), so we can compare the details between each heap profile capture by using the following commands.
go tool pprof -http=:8080 --base dumps/heap-profile-cmp-001.pb.gz dumps/heap-profile-cmp-002.pb.gz
go tool pprof -http=:8080 --base dumps/heap-profile-cmp-001.pb.gz dumps/heap-profile-cmp-003.pb.gz
And we can see the differences between both profiles to see how our application is behaving.
And that’s all folks. This was a lot of information and hopefully it will be of use to someone.
If you have some comments or remarks, let me know in the comment section.