Automatic collection of prometheus metrics, cadvisor and grafana in Docker Swarm
Last time in were exposing some metrics for a golang application, but exposing the data is useless without having a way to visualise it or even store it somewhere in a location so we can analyze it when needed.
Some of the tools that we can use to do this are
At this point, I will assume have a docker swarm cluster available and ready to use.
Let’s create a stack file that will allow us to replicate this one on another swarm easily. All the required resources are on github.com/ilijamt/gomeetupamsnov2018
We need some prerequisites first
- Network for the monitoring applications
- Node metrics exporter/prometheus
- Prometheus
- Grafana
- cAdvisor
- Application that will expose metrics
Let’s create a very simple application that will build a small service that will expose various metrics.
main.go
package main
import (  "github.com/prometheus/client_golang/prometheus"  "github.com/prometheus/client_golang/prometheus/promhttp"  "net/http")
func main() {  prometheus.MustRegister(prometheus.NewGauge(prometheus.GaugeOpts{    Name: "version",    Help: "Version information about this service",    ConstLabels: map[string]string{      "version": "v1.1.51",      "service": "demo",    },  }))
  http.Handle("/metrics", promhttp.Handler())  if err := http.ListenAndServe(":2112", nil); err != nil {    panic(err)  }}
We need to create 2 services off the code and build create the docker images, running these commands will build and tag the images
docker build demo-v1 -t gomeetup-demo-v1:latestdocker build demo-v2 -t gomeetup-demo-v2:latestI think everyone should be able to understand the stack file bellow.
stack.yaml
version: "3"
networks:  monitoring:  api:
services:  demo_service_v1:    image: gomeetup-demo-v1:latest    deploy:      mode: replicated      replicas: 6    networks:      - monitoring      - api  demo_service_v2:    image: gomeetup-demo-v2:latest    deploy:      mode: replicated      replicas: 4    networks:      - monitoring      - api  cadvisor:    image: google/cadvisor:latest    deploy:      mode: global    ports:      - "8080:8080"    volumes:      - /var/lib/docker/:/var/lib/docker      - /dev/disk/:/dev/disk      - /sys:/sys      - /var/run:/var/run      - /:/rootfs      - /dev/zfs:/dev/zfs    networks:      - monitoring  grafana:    image: grafana/grafana    ports:      - "3000:3000"    volumes:      - ./data/grafana:/var/lib/grafana:rw    deploy:      mode: replicated      replicas: 1    environment:      - GF_SECURITY_ADMIN_PASSWORD=admin      - GF_USERS_ALLOW_SIGN_UP=false    networks:      - monitoring  prometheus:    image: prom/prometheus:latest    ports:      - '9090:9090'    volumes:      - ./prometheus.yml:/etc/prometheus/prometheus.yml:ro      - ./data/prometheus:/prometheus:rw    deploy:      mode: replicated      replicas: 1    networks:      - monitoring
We also need to create the configuration for prometheus so we can get the data automatically off the services.
global:  evaluation_interval: 15s  scrape_interval: 15s
scrape_configs:  - job_name: services    metrics_path: "/metrics"    scrape_interval: 10s    dns_sd_configs:      - names:          - 'tasks.demo_service_v1'          - 'tasks.demo_service_v2'        type: 'A'        port: 2112  - job_name: cadvisor    metrics_path: /metrics    scrape_interval: 30s    dns_sd_configs:      - names:          - "tasks.cadvisor"        type: 'A'        port: 8080
What this will do is create 2 jobs that will collect the metrics, at their specified periods, the
tasks.
Now to deploy this stack we can just issue the command bellow.
docker stack deploy gomeetupamsnov -c stack.ymlThis will spin up all the necessary services required for this to work, after which we will be able to access.
- cAdvisor on port 8080
- Prometheus on port 9090
- Grafana on port 3000
Load up some dashboards, there are plenty available on grafana’s page.
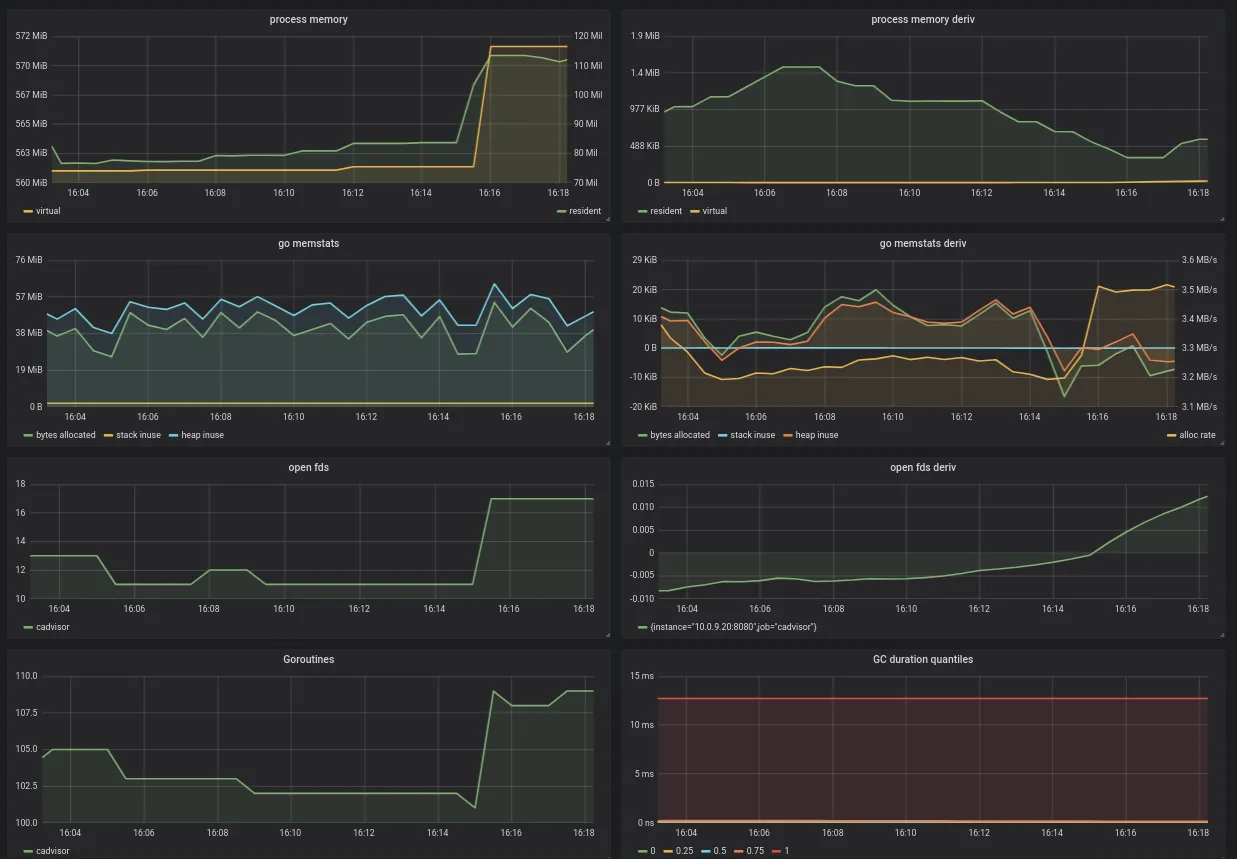
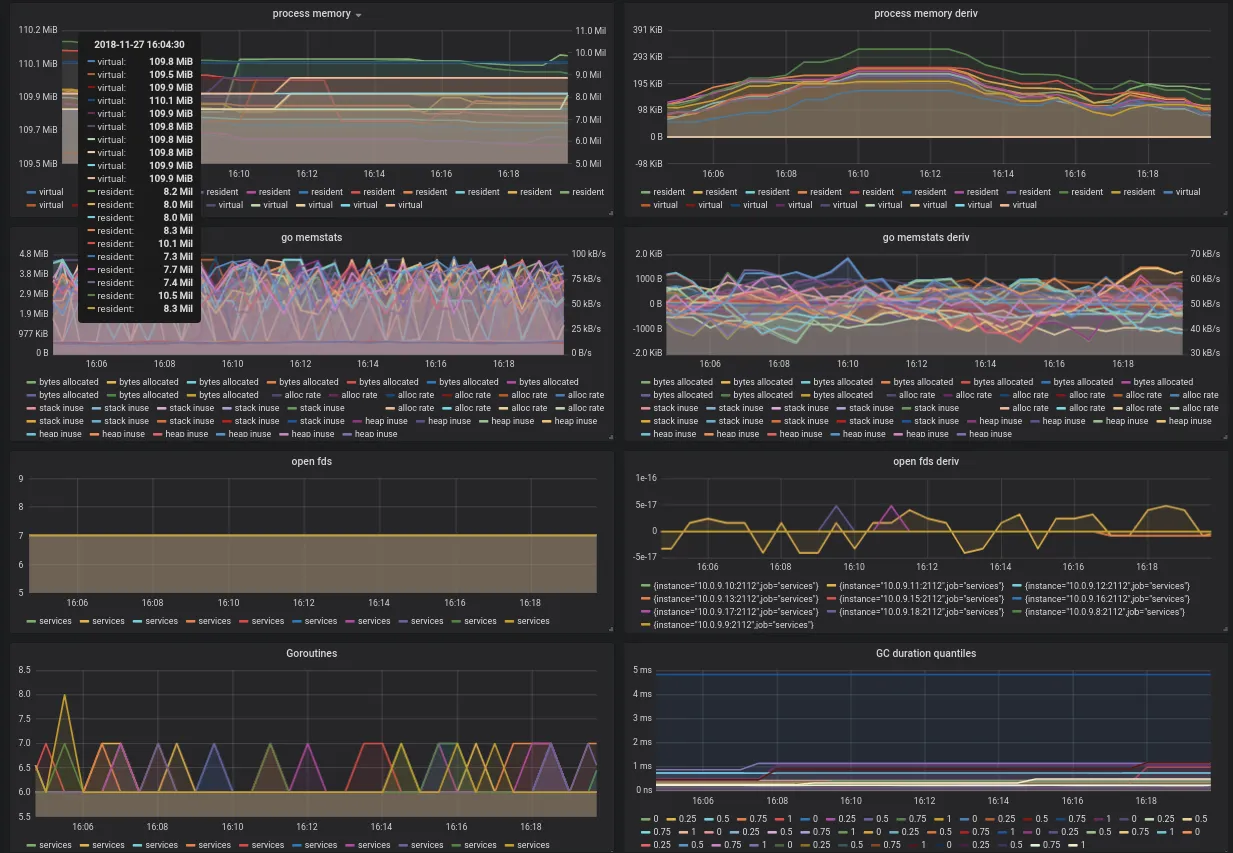
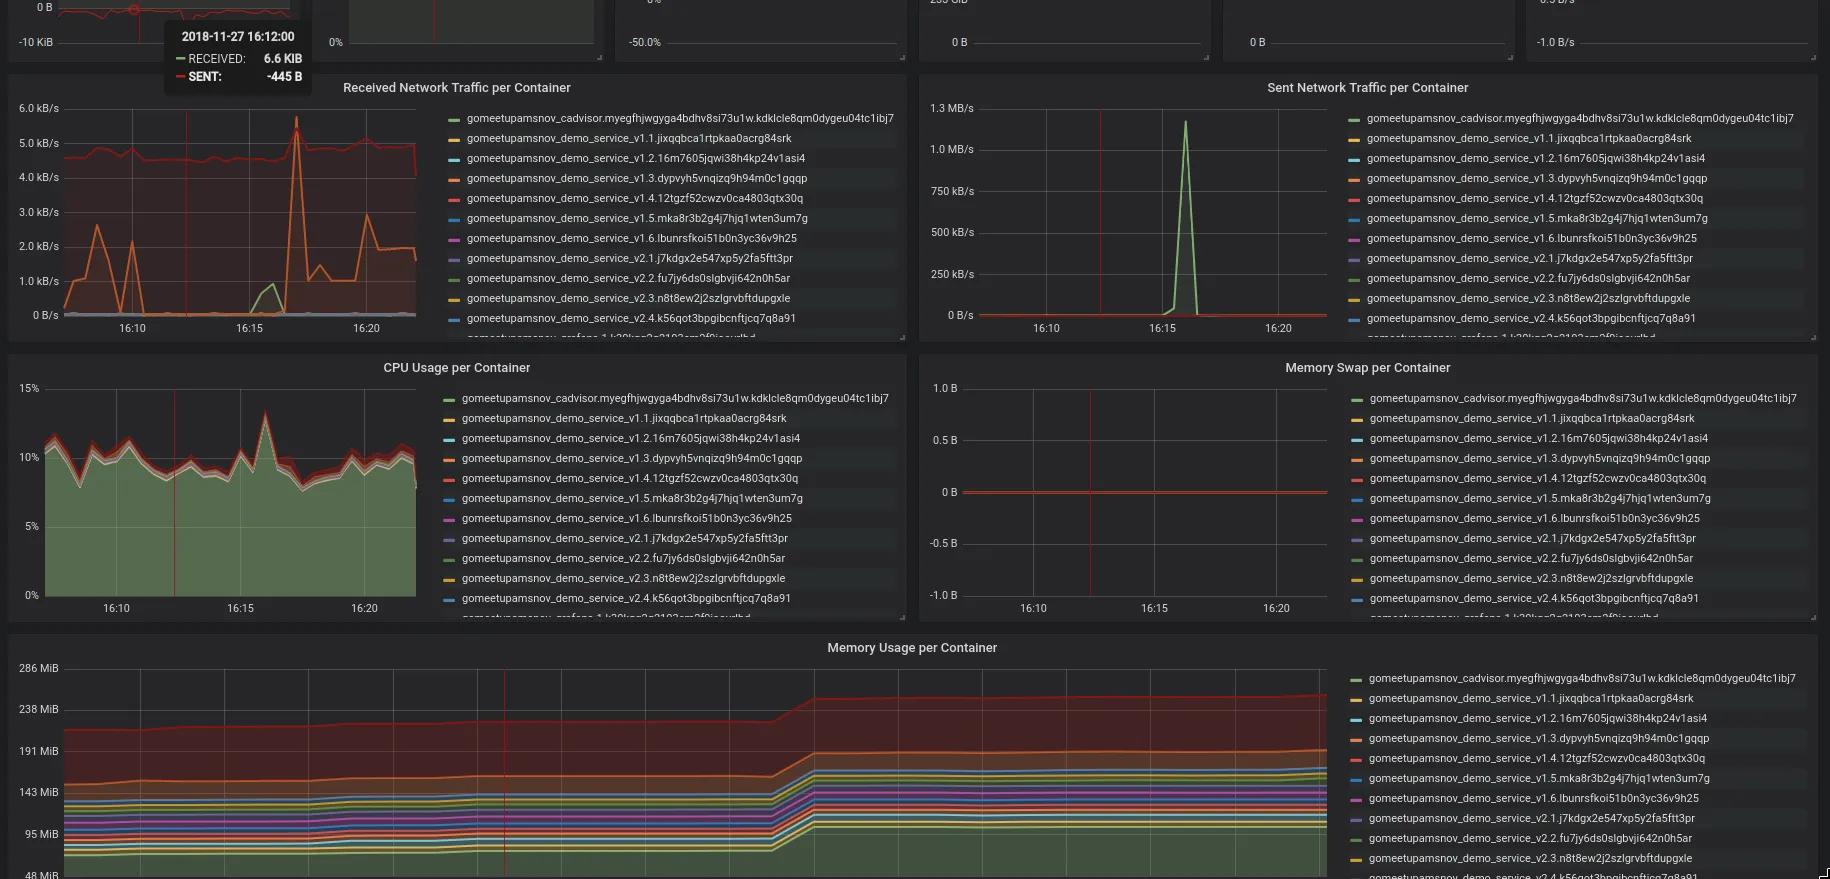
And voila we have some dashboards with information relevant to us.
Golang process data regarding cAdvisor
Golang process data regarding the demo services
Docker data from cAdvisor
Next steps
- Automatic configuration of jobs, we can use consul for this, so anytime a new service is added we pick it up right away
- Adding node exporter instead of full prometheus inside the swarm (done for simplicity)
- Setting up alerting based on our parameters